
Diving into a brand-new scientific field usually starts with an overwhelming list of references. You read a single study, scan sixty citations in the bibliography, open dozens of tabs, and still have no clue which papers are foundational classics and which are irrelevant footnotes.
That manual digging burns hours of reading time without giving you a clear picture of the academic landscape. You end up reading secondary papers that rehash ideas already established a decade earlier.
Connected Papers (connectedpapers.com) solves that navigational headache right in your browser. Instead of presenting a flat chronological list, it analyzes co-citation networks to build a visual cluster graph that instantly reveals the most influential papers in any domain.
The 3-Step Visual Graph Workflow
- Open connectedpapers.com in your browser. No software installation, terminal commands, or credit cards are needed. The tool runs directly inside Chrome, Safari, or Edge.
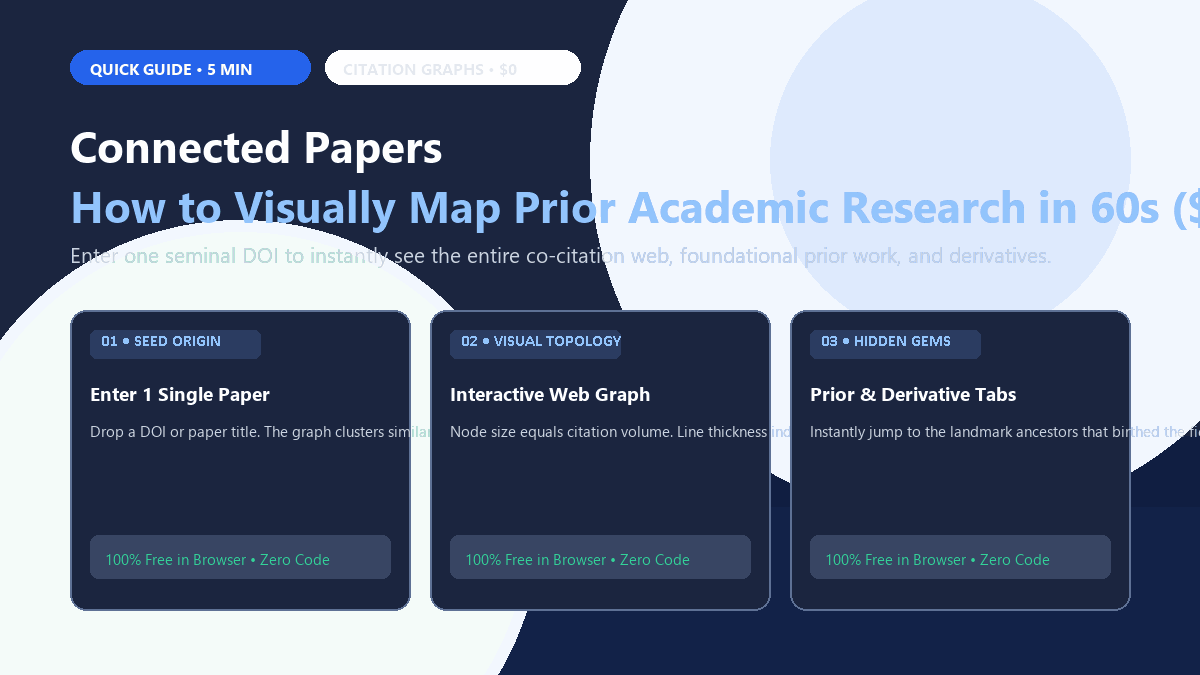
- Enter a single seminal paper. Paste a DOI, PubMed ID, arXiv identifier, or paper title into the search bar. Click "Build a Graph." Within 15 seconds, an interactive network visual appears.
- Navigate clusters, Prior Works, and Derivatives.
- Node Size: Represents the volume of citations (larger circles indicate highly cited studies).
- Color Darkness: Indicates publication year (darker nodes are recent, lighter nodes are older).
- The Secret Weapon: Click the Prior Works button in the left sidebar. This displays papers cited by almost every node in the graph, revealing the foundational ancestors of that research area.
If you want to track subsequent milestones and clinical meta-analyses that followed your seed paper, click the Derivative Works tab to see recent papers that heavily cited this entire cluster.
Where It Falls Short
- Free account monthly quota: Unregistered visitors can build up to five free graphs per month. Creating a free account unlocks occasional promotional allowances, but heavy power users eventually hit a monthly ceiling.
- Non-citation similarity gaps: Because the graph relies on citation topology rather than deep full-text semantic NLP, brand-new papers published this week may lack the citation volume needed to form cluster edges.
- Humanities and non-indexed fields: While biomedical, computer science, and physics literature coverage from Semantic Scholar is extraordinary, niche humanities monographs can occasionally return empty graphs.
If you also need to decode confusing mathematical jargon inside those papers, pair this visual graph with our 60-second guide on using Explainpaper to demystify complex academic equations, check our guide on mapping interactive citation webs in ResearchRabbit, or trace timeline momentum with our guide to visual citation mapping in Litmaps.