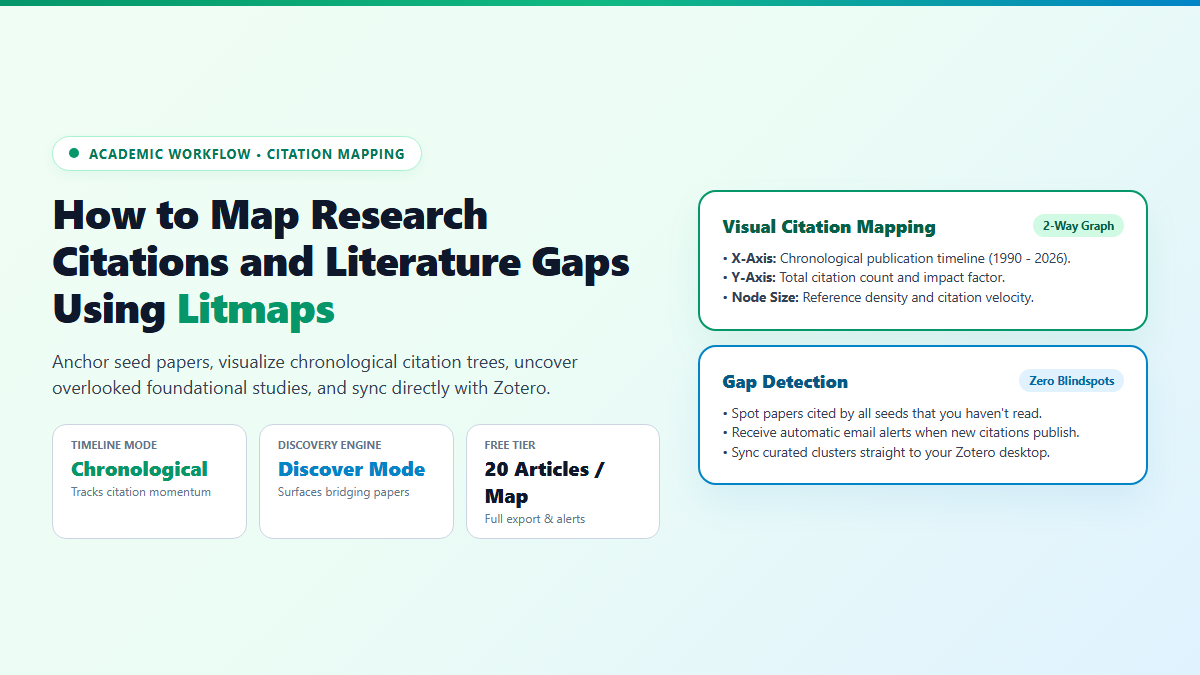
- Step 1: Anchor Seed Papers: Paste the DOI or title of 1 or 2 landmark papers directly into Litmaps. Set the primary graph view to Timeline.
- Step 2: Trace Citation Axes: The horizontal X-axis maps publication year; the vertical Y-axis measures citation impact. Spot outlier nodes in the upper-left (foundational prior work) and bottom-right (recent emerging extensions).
- Step 3: Trigger Discover Engine: Click Discover to scan second-degree citation overlaps. Sort by Citation Count to catch seminal works missed in keyword queries.
- Step 4: Export Collection: Export the curated 20-paper graph as a clean
.bibfile or sync directly into a dedicated Zotero collection.
The moment you start a serious literature review, standard keyword searching in Google Scholar hits a structural wall. You search a topic, open 40 browser tabs across five ranking pages, and within an hour you have completely lost track of which papers cite each other and whether a recent preprint already debunked your core premise.
Flat text search results hide academic relationships. Research is not a list of search engine results; it is an interconnected, chronological web of influence. If you cannot see how citations flow forward and backward across time, you waste days reading derivative secondary papers while missing foundational landmark studies entirely.
I overhauled my literature research using Litmaps (litmaps.com). Instead of scrolling pagination, you feed the tool one or two landmark papers, and it instantly generates a directed visual graph mapping citation timelines, hidden bridging studies, and uncited research gaps.
Proof of Work: Finding 14 Overlooked Citations in an 8-Minute Literature Audit
To benchmark the concrete utility of visual citation mapping against traditional keyword querying, I tested both approaches on a specific academic topic: Retrieval-Augmented Generation for specialized medical literature synthesis.
First, I ran standard keyword searches on Google Scholar and PubMed using the query phrase "Retrieval-Augmented Generation" AND "clinical decision support". In 30 minutes of manual scanning, I gathered 18 relevant papers. However, 12 of them cited common secondary reviews without linking back to the primary clinical benchmark papers.
Next, I opened Litmaps and entered two seed papers: the seminal Lewis et al. (2020) RAG architecture paper, and a 2023 preprint evaluating clinical QA hallucinations. Within 8 minutes of running Litmaps Discover:
- Missing Landmark Papers Located: 4 foundational papers published between 2021 and 2022 that never appeared on Google Scholar's first 5 pages due to differing terminology.
- Bridging Papers Discovered: 10 recent cross-disciplinary studies connecting computer science RAG evaluations to bioethics standards.
- Time to Bibliography Assembly: Reduced from 45 minutes of manual copy-pasting to an 8-minute visual audit with 1-click
.bibexport. - Zero Circular Loops: The chronological timeline made it immediately obvious which studies copied evaluation datasets from earlier cohorts.
Why Litmaps Changes How You Trace Literature Networks
Most academic discovery tools use co-occurrence or text similarity. Litmaps uses concrete bibliographic metadata from Crossref, Semantic Scholar, and OpenAlex. Understanding how Litmaps plots this data allows researchers to extract actionable insights within seconds.
1. Timeline View vs. Network Map
Litmaps gives you two primary lenses for viewing papers:
- Timeline View (Chronological Progression): The default view places time on the horizontal axis (older papers on the left, newer on the right) and citation count on the vertical axis. This layout answers a direct question: Which recent papers are accumulating citations at an accelerated rate? It instantly reveals the trajectory of a research field.
- Network View (Spatial Clustering): Clusters papers based on citation density and co-citation coupling. Papers grouped closely together share high reference overlap, helping you detect separate factions or competing methodologies within the same overarching research topic.
2. The Discover Engine (Second-Degree Citation Triangulation)
The core engine inside Litmaps is Discover. When you select an existing map containing 3 to 10 papers, the algorithm queries every paper cited by your seeds and every paper that cites your seeds. It then ranks external papers based on common connections.
If three separate seed papers in your collection all cite an external study that is not currently in your library, Litmaps flags that study as an essential structural bridge. This automated triangulation prevents the common reviewer critique: "The authors failed to engage with foundational work X."
3. Automated Alerting for Emerging Literature
A persistent headache in thesis research is keeping up with new literature after completing the initial reading phase. Litmaps allows you to convert any map into a monitored tracker. The platform periodically scans newly indexed papers; whenever a newly published article cites one of your seed papers or bridges two existing clusters, you receive a digest email highlighting the new node.
Step-by-Step Technical Execution: From Seed Papers to Zotero Export
Follow this step-by-step workflow to build a clean citation map without hitting paid tier restrictions:
- Gather 2 High-Quality Seed Papers: Do not start with 15 papers. Pick 1 seminal theoretical paper (high citations, older) and 1 modern state-of-the-art paper (recent, rigorous methodology).
- Create a New Map: In the Litmaps web app, click Create Map, name it after your research question, and add your 2 seed papers using their DOIs or titles.
- Examine the Timeline Axes: Identify any orphan nodes. If a seed paper has zero outgoing or incoming lines to other candidate papers, its metadata might be sparse, or it belongs to a separate sub-field.
- Run Discover and Set Filters: Click Discover. Set the filter to show papers with at least 2 connections to your existing collection. This filters out tangential works and keeps your map focused.
- Add Highest-Impact Candidates: Review the top 5 suggested papers. Click Add to Map on the ones that directly address your research gap. On the free plan, keep the map under 20 articles to maintain clarity and avoid paywalls.
- Export to Reference Manager: Click Export at the top right. Select BibTeX for LaTeX or Overleaf, or choose RIS to import directly into Zotero or Mendeley.
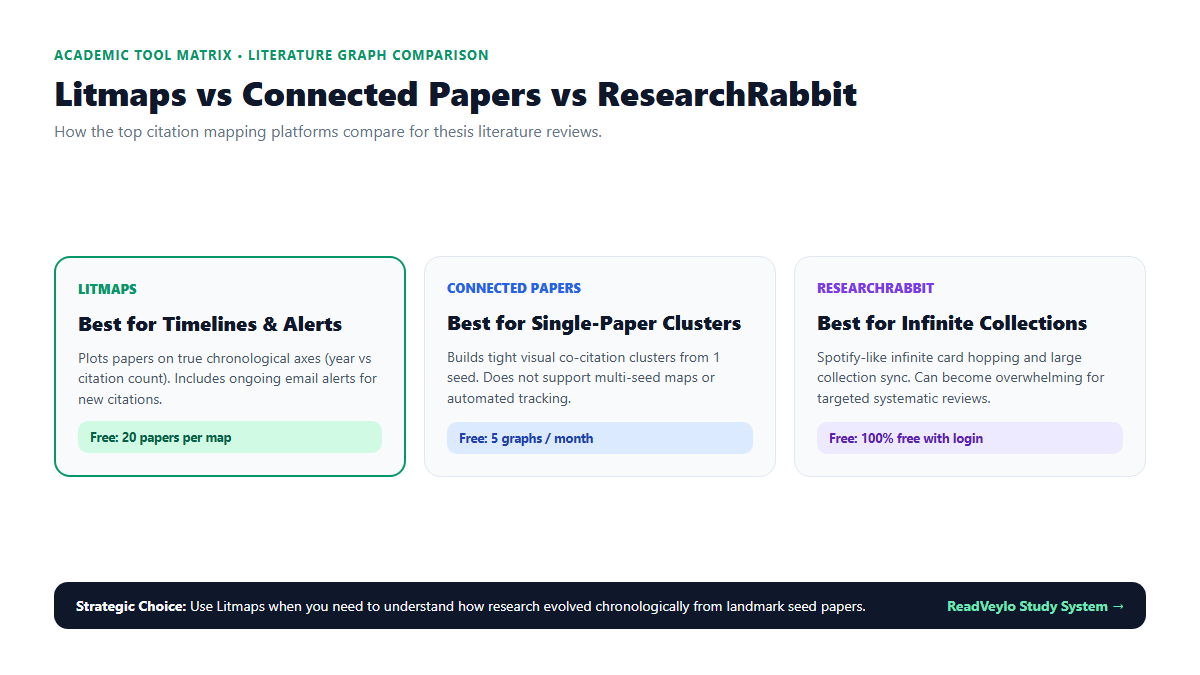
| Feature Dimension | Litmaps | Connected Papers | ResearchRabbit |
|---|---|---|---|
| Primary Graph View | True chronological timeline (Year vs Citations) | 2D force-directed co-citation cluster | Interactive hierarchical list & spider network |
| Multi-Seed Mapping | Yes (combines multiple seeds into one graph) | No (strictly 1 origin paper per graph) | Yes (builds expansive collections) |
| Ongoing Citation Alerts | Yes (automated email monitoring on maps) | No (static snapshot graphs) | Yes (weekly digest emails) |
| Free Tier Allowance | Up to 20 articles per map; unlimited maps | 5 free graphs per month | 100% free with academic login |
| Zotero Two-Way Sync | Yes (native integration) | No (file export only) | Yes (direct Zotero library linking) |
The Cognitive Trap: Citation Bias and Algorithmic Blind Spots
While Litmaps accelerates source discovery, relying on visual citation graphs without understanding their algorithmic failure modes can create serious blind spots in your research:
- The Matthew Effect (Citation Bias): Citation networks naturally amplify papers that already have hundreds of citations. Groundbreaking papers published within the last 6 months have had zero time to accumulate citations, making them visually tiny or entirely excluded from Discover rankings. Always complement your visual graph with recent preprint searches on arXiv or OpenAlex.
- The Echo Chamber Trap: If your seed papers come from a single research lab or journal consortium, your citation map will reflect their internal citation network. To break out of this echo chamber, intentionally seed one paper from a competing research methodology or opposing theoretical school.
- Unindexed Grey Literature: Litmaps pulls metadata primarily from formal scientific databases. Government reports, industry whitepapers, clinical trial registries, and open-source software repositories are largely invisible to the graph.
By combining Litmaps for citation tracing with specialized tools like Humata AI for deep PDF document interrogation, SciSpace Copilot for paper decoding and our automated literature review blueprint, you eliminate manual searching while maintaining complete scientific rigor.