
Tracing the genealogy of an academic idea by hand is brutal. You find one promising paper, scroll down to its forty-entry bibliography, look up five references on Google Scholar, hit three paywalls, and repeat the cycle until your browser has forty open tabs and your thesis notes are a disconnected mess.
If you miss a pivotal foundational paper from five years prior, your dissertation committee will point it out immediately. But manual footnote hopping gives you zero perspective on which authors actually drove the field forward versus who just threw in a courtesy citation.
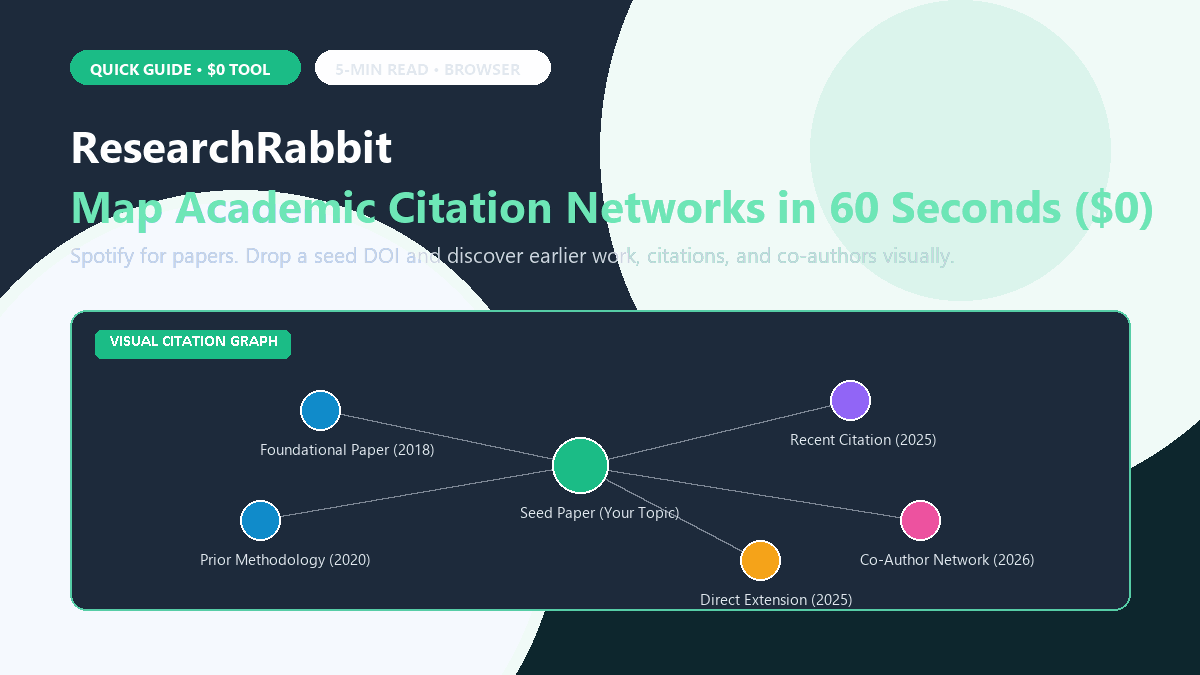
ResearchRabbit fixes that entire research bottleneck. Known as "Spotify for papers," it takes a single DOI you already know and generates an interactive, clustered citation web that shows you the foundational work, recent derivative studies, and dominant co-authors in sixty seconds for $0.
The 3-Step Workflow
- Open researchrabbitapp.com and create a free account. It is 100% free for researchers and students. You can optionally link your Zotero library with a single click to sync collections automatically.
- Add one "Seed Paper" to a collection. Paste the title or DOI of the most relevant study you have read so far. ResearchRabbit indexes over 100 million scholarly works and immediately retrieves the document metadata.
- Explore the Interactive Citation Web. Click "Earlier Work" to see the foundational papers your seed paper cites, or "Later Work" to see recent studies expanding on it. You can switch between node graph mode and timeline view to watch how the research conversation evolved chronologically.
Clicking any paper node in the graph pulls up its abstract, citation count, open-access PDF link, and co-authors. If you find three more relevant studies, add them to your collection, and the graph automatically recalculates to highlight the shared intellectual intersections.
If you want a 60-second visual similarity cluster centered around a single seed paper with instant Prior Works root nodes, see our 60-second Connected Papers guide, or learn how to plot chronological timelines and citation momentum with our in-depth Litmaps guide.
Where It Falls Short
- Not a search engine for brand-new topics. ResearchRabbit is a citation network mapper, not Google. It works best when you already have at least one strong anchor paper. If you start with a vague or irrelevant seed paper, the graph will pull you into an irrelevant academic tangent.
- Cross-disciplinary blind spots. If a paper in computer science applies a methodology from cognitive psychology, citation connections across discipline boundaries are sometimes sparser than intra-field connections.
- Requires active filtering. A dense graph can display 80+ paper nodes at once. You must use the publication year slider to trim out obsolete studies.
For zero dollars, ResearchRabbit turns hours of tedious bibliography rabbit holes into a clear 60-second visual map. It belongs in every student's research toolkit.